Troubleshoot disk IO bottleneck
本文标题的含义是:排查disk IO瓶颈。
haydenjames Linux server performance: Is disk I/O slowing your application?
If your Linux server is bogged down, your first step is often to use the TOP command in terminal to check load averages and wisely so. However, there are times when TOP shows very high load averages even with low cpu ‘us’ (user) and high cpu ‘id’ (idle) percentages. This is the case in the video below, load averages are above 30 on a server with 24 cores but CPU shows around 70 percent idle. One of the common causes of this condition is disk I/O bottleneck.
Disk I/O is input/output (write/read) operations on a physical disk (or other storage). Requests which involve disk I/O can be slowed greatly if CPUs need to wait on the disk to read or write data. I/O Wait, (more about that below) is the percentage of time the CPU has to wait on disk. To begin, let’s look at how we can confirm if disk I/O is slowing down application performance by using a few terminal command-line tools (top, atop and iotop) on a LEMP installed dedicated server.
Using TOP command – load averages and wa (wait time)
As per the video above, when you enter top, you’ll first glance to the top-right to check load averages. Which in this case, are VERY high and thus indicate a pileup(堆积) of requests. Next, we most likely will glance at the cpu and mem horizontal lines near the top, followed by the %CPU and %MEM columns to get an idea of which processes are using most resources.
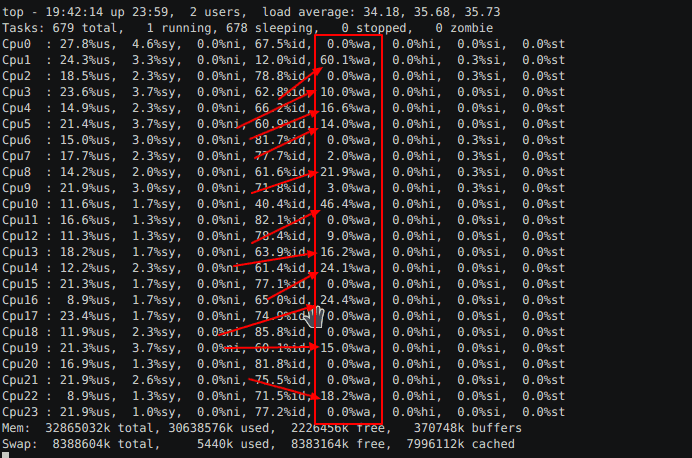
While in top, you will also want to look at ‘wa’ (see video above) it should be 0.0% almost all the time. Values consistently above 1% may indicate that your storage device is too slow to keep up with incoming requests. Notice in the video the initial value averages around 6% wait time. However, this is averaged across 24 cores, some of which are not activated because the CPU cores are not nearing capacity on their own. So we should expand the view by pressing ‘1’ on your keyboard to view wa time for each cpu core when in use. As per the screenshot above, there are 24 cores when expanded, from 0 to 23. Once we’ve done this, we see that ‘%wa’ time is as high as 60% for some cpu cores! So we know there’s a bottleneck, a major one. Next, let’s confirm this disk bottleneck.
Using ATOP command to monitor DSK (disk) I/O stats
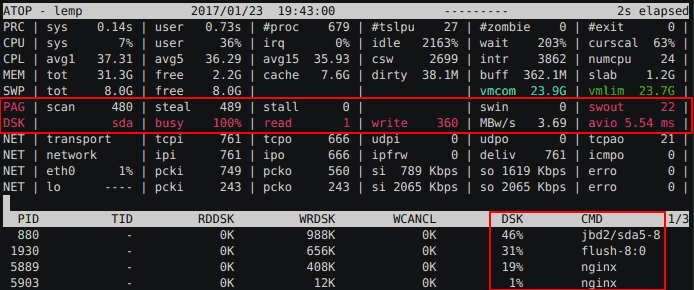
Using atop, next, we see that the storage device is 90 to 100 percent busy. This is a serious bottleneck. The effect is that requests are blocked until disk I/O can catch up. While in atop press ‘d” to view the processes and PIDs which are using disk I/O. Here we see MySQL, Nginx, and PHP-FPM which are necessary processes and I would have to write another article about reducing disk I/O on high traffic L*MP servers. In short, be careful that Nginx (or Apache), MySQL, and PHP-FPM’s access and error logs are not set up to write too frequently to disk and you want to also avoid storing cache (eg. Nginx cache) to disk in very high concurrent traffic environments. In addition to LEMP services, notice also ‘flush-8:0’ (traced to be PHP cache issue) and jbd2/sda5-8 (traced to access/kernel logs) along with their PIDs.
On this server, I was able to perform a quick benchmark of the SSD after stopping services and noticed that disk performance was extremely poor. The results: 1073741824 bytes (1.1 GB) copied, 46.0156 s, 23.3 MB/s. So although reads/writes could be reduced, the real problem here is extremely slow disk I/O. This client’s web host provider denied this and instead stated that MySQL was the problem because it often grows in size and suffers OOM kill. To the contrary, MySQL growing in memory usage was a symptom(症状) of disk I/O blocking the timely return of MySQL queries and with MySQL’s my.cnf max_connections setting on this server being way too high (2000), it also meant that MySQL’s connections and queries would pile up(堆积) and grow way beyond the available server RAM for all services. Growing to the point where the Linux Kernel would OOM kill MySQL. Considering MySQL’s max allocated memory equals the size of per-thread buffers multiplied by that ‘max_connections=2000’ setting, this also left PHP-FPM with little free memory as it also piled up connections waiting on MySQL < disk. But with MySQL being the largest process, the Linux kernel opts to kill MySQL first.
Using IOTOP command for real-time insight on disk read/writes
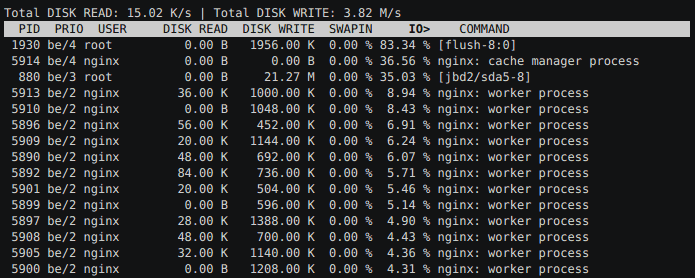
iotop watches I/O usage information output by the Linux kernel and displays a table of current I/O usage by processes or threads on the system. I used the command: iotop -oPa. Here’s an explanation of those options.
-o, –only (Only show processes or threads actually doing I/O, instead of showing all processes or threads. This can be dynamically toggled by pressing o.)
-P, –processes (Only show processes. Normally iotop shows all threads.)
-a, **–accumulated (**Show accumulated I/O instead of bandwidth. In this mode, iotop shows the amount of I/O processes have done since iotop started.)
Look at the ‘DISK WRITE’ column, these are not very large figures. At the rate they increment, a fairly average speed storage device would not be busy with some kernel logging and disk cache. But at < 25 MB/s write speed (and over-committing memory) disk IO is maxed out by regular disk use from Nginx cache, kernel logs, access logs, etc. The fix here was to replace the storage with a better performing device, something with faster write speeds than an SD card.
Of course, MySQL should never be allowed to make more connections than the server is capable of serving. Also, the workaround of throttling incoming traffic by lowering PHP-FPM’s pm.max_children should be avoided or only temporary because this means refusing web traffic (basically moving the location of the bottleneck). Thankfully, the above case of a storage device being this slow is not common with most hosting providers. If you have a disk with average I/O, then you could also use Varnish cache or other caching methods, but these will only work as a shield when fully primed. If you have enough server memory, always opt to store everything there first.
I hope this short article was useful. Feel free to leave tips, feedback, and/or tools below or contact me directly. Also, have a look at this list of top 50 APM tools.
Here are some additional command line tools used: iostat, dstat, lsof, vmstat, nmon, sar, iptraf iftop, netstat, lsof, pvdisplay, lspci, ps.